This is week in Digital Marketing This Week—the fifth and final episode in our Google Analytics series! This time we answered, “How Do I Customize Google Analytics?”
This Week's Episode:
Again—as we discuss today’s episode, be sure to choose one idea and go ahead and practice it. And you have a lot to choose from today—
- How to use dashboards
- Learn why shortcuts are useful
- How to automate error reporting
- And the most dangerous report EVER
These can basically be found in this section right here:
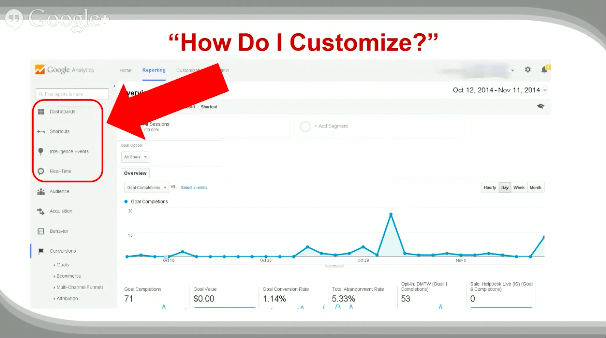
Let’s start with DASHBOARDS
Dashboards
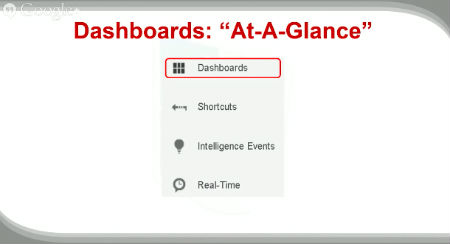
When you click on Dashboards, you’ll see two separate options:
Private – A way to share dashboards to specific people. It’s basically made from a collection of widgets that give you a summary of the reports and metrics that you are tracking.
New Dashboard – Which allows you to create and personalize a new one yourself.
This section is really great for summary data and does require a little practice. So if you want to get a more in-depth tutorial, watch the entire webinar for a live, step by step walkthrough of how to create and customize your dashboard widgets.
Next is SHORTCUTS
Shortcuts
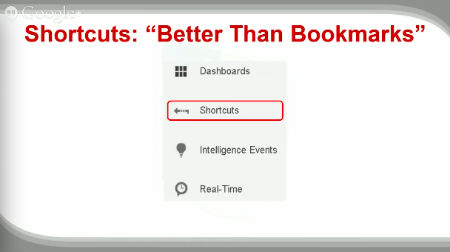
Shortcuts give you access directly into the actual report and it makes it really easy for you to go to a particular report over and over again. It works kind of like bookmarks, but a lot better. To set it up, catch the full webinar for our live demonstration.
Intelligence Events
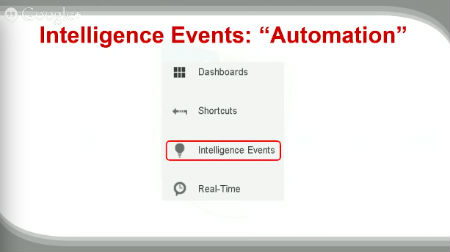
INTELLIGENCE EVENTS is all about Automation
Intelligence reports are available several forms–overview, daily events, weekly events and monthly events.
What you’re basically doing is setting up alerts that are meant to monitor statistical changes in your web traffic, depending on your settings. You can do this for a lot of things such as transactions and goals.
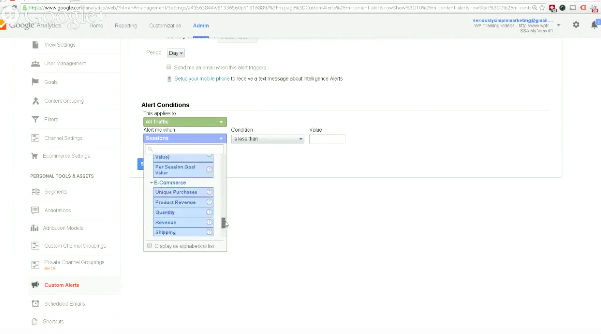
If all those tabs and dropdowns are confusing you at this point, don’t worry. We have a live demonstration of how to set up the different settings for this section to walk you through it.
Next up, REAL-TIME–
Real-Time
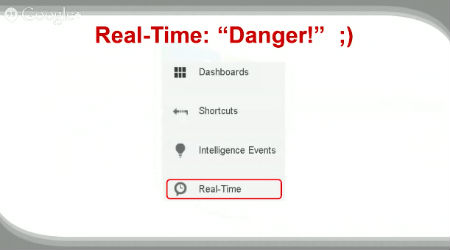
One of the most useful, and one of the most dangerous as well!
It’s dangerous, because when you have a lot of traffic coming through (like an event or a campaign going), you can get stuck watching this report for a LONG time. (It's fun to watch everything working!)
Spending too much time on it is counter-productive–it’s great for tracking, monitoring and understanding user usage and TESTING to make sure things are reporting through. Don’t get too caught up on it.
In Conclusion…
If you haven’t yet, be sure to watch the entire webinar and choose one idea that you can take, learn and practice that as you familiarize yourself with Google Analytics.
For more, join the DMTW Insiders club (you'll see a form below for that).
Questions? No problem! Just leave a comment below…
– Mercer
Our SlideShare Slides:
Have a question?
Get access to the live Digital Marketing This Week webinar, including a chance to get answers to your toughest marketing challenges! Enter your name and email below:
![]() We value you and your information is kept safe.
We value you and your information is kept safe.
