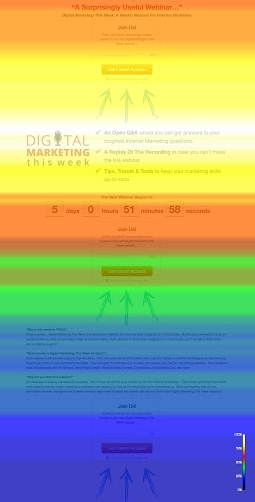
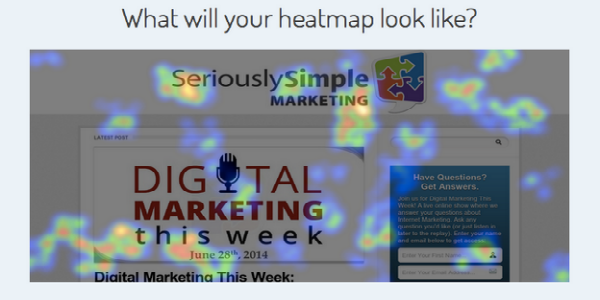
When heat maps say that they’re tracking the visitors’ behavior in relation to your website, they’re not doing it by eye tracking.
Instead, they track the movement of your visitors mouse on a particular page to give you an idea of where people are spending time on your page.
It doesn’t necessarily give you a 100% accurate data, but it’s enough to let you know which areas you should improve, which sections you should focus on, and how you should edit your pages to get the most conversions.
The data you get from heatmaps are best used and studied with information gathered from Google Analytics. Because while Google Analytics metrics can give you quantitative data, heatmap analytics give you more qualitative information that drills down to specifics and measures how users interact with your page.
Things such as:
- Areas of your landing page that get the most clicks.
- Sections of your page that get most hovers.
- Specific parts of the page where page visitors tend to focus their attention on.


Sections that get the most interaction by way of clicks, hovers, and movement are seen in red; while other sections that receive the least attention appear in blue.
Here are some important website elements heatmaps can track…
Heatmaps show you where on your page visitors click
Heatmaps can easily show which areas on your page get the most clicks, therefore visually proving what interests your audience. This means, you can now know what content, service, or product your visitors really care about, and what they want to see.
Heatmaps show you sections that visitors don’t really care about
On the flipside, heatmaps give you a clear picture of sections on your site that your visitors don’t pay attention to. You now have the option to rearrange your pages so that items that catch visitors’ attention are in the right areas, and information that your page visitors don’t really care about can be moved away from it to encourage more engagement. Heatmaps can help to minimize clutter on your website.
Heatmaps give you an opportunity to draw attention to relevant information
If you notice that particular sections of the page get more engagement by virtue of position, you can place elements of the page that you want to focus on these sections. Studying your heatmap means you can learn which areas of your website visitors focus on, and you can use that to your advantage.
Heatmaps remind you that the navigation on your site is important
Your navigation, as you probably already know, needs to be simple and clear. But with a heatmap, it shows you which areas of your pages get click on the most. Knowing that, you can now arrange your navigation to either replicate what your most clicked on sections have or pull focus on these sections to improve interaction with your users.
Heatmaps prove just how important headlines are
Headlines are already an important part of drawing your visitors in, but heatmaps will show just how much—you may notice discrepancies such as longer headlines getting less clicks than shorter, more succinctly written ones, or benefit driven headlines getting more interest versus teaser headlines.
Track your results closely so that you can see what areas you can improve on.
Right now, for my heatmap analytics, I’m partial to a service called Crazy Egg. We’ve been using it for a while now.
What are your thoughts on heatmaps? Do you use other tools or have questions? Just leave a comment below…
– Mercer
Our SlideShare Slides:
